
Flood
Flooding is the most frequent and costly natural hazard in the United States—a hazard that causes more fatalities than any other natural hazard and averages nearly $10 billion in losses per year. Nearly 85 percent of federal disaster declarations result from natural events where flooding was a major factor.
Technically, a flood is a general and temporary condition of partial or complete inundation of normally dry land areas from: (1) the overflow of stream banks; (2) the unusual and rapid accumulation of runoff of surface waters from any source; or (3) mudflows or the sudden collapse of shoreline land. Flooding results when the flow of water is greater than the normal carrying capacity of the stream channel or accumulates faster than surface absorbency allows (Colorado Natural Hazards Mitigation Plan). The severity of a flood event is typically determined by a combination of several factors, including but not limited to precipitation and weather patterns, stream and river basin topography and physiography, stormwater conveyance capacities, recent soil moisture conditions, and the degree of vegetative clearing and/or impervious surface coverage.
Floods in Colorado generally result from the accumulation of water from excessive precipitation and/or rapid snowmelt. They can be classified under two categories: general floods, resulting from heavy precipitation or snowmelt in a given watershed over an extended period of time; and flash floods, the product of heavy localized precipitation in a short time period.
General floods are typically long-term events that may last for multiple days, and over widespread areas. The primary type of general flooding in Colorado is associated with lands adjacent to riverine and lake areas, and is a function of excessive precipitation levels and the inability of natural systems to adequately absorb or convey the resulting volume of runoff. Urban/stormwater flooding occurs where development has obstructed the natural flow of water and decreased the ability of natural groundcover to absorb and retain surface water runoff.
More frequent in Colorado is flash flooding, most of which is caused by slow-moving thunderstorms with intense but isolated rainfall. Such events develop rapidly and are intensified by major elevation changes, steep slopes, and base alluvial fans that characterize mountain river canyons. Flash flooding events may also be caused by a sudden failure or release by a dam, levee, retention basin, or other stormwater control facility, or by the obstruction of natural flows by ice jams or other blockages that cause backflow and overtopping. Although flash flooding occurs most often along Colorado’s mountain streams, it is also common in urbanized areas where much of the natural landscape is covered by impervious surfaces.
The periodic flooding of lands adjacent to rivers, streams, lakes, and other water bodies (land commonly known as “floodplain”) is a natural and inevitable occurrence that can be expected to take place based upon established recurrence intervals. The recurrence interval of a flood is typically defined as the average projected time (in years) between a particular magnitude flood event or annual percent chance of that flood occurring. For example, the “100-year” flood has a one percent chance of occurring in any given year, and the “500-year” flood has a 0.2 percent chance of occurring in any given year—and these two distinct magnitudes are the basis for the special flood hazard areas identified in FEMA Flood Insurance Rate Maps (FIRMs). The recurrence interval is an average; it does not necessarily mean that a flood of such a magnitude will happen exactly every 100 years or 500 years, and in some cases only a few years may pass between major flood events.
It is important to note that flooding is not always confined to special flood hazard areas identified by FEMA. Therefore, evenhomes that are not in the mapped floodplain should exercise caution and diligence during flood events and should prepare themselves before flooding occurs. Some jurisdictions regulate based on their own, more stringent floodplain maps. Fluvial Hazard Zone Maps are being developed in some communities to capture additional flood risk. See Fluvial Hazards for more information on identifying and planning for these flood-related hazards.
Applicable Planning Tools and Strategies
Addressing Hazards in Plans and Policies
- Comprehensive Plan
- Climate Plan
- Exploratory Scenario Planning
- Hazard Mitigation Plan
- Parks and Open Space Plan
- Pre-disaster Planning
- Resilience Planning
- 1041 Regulations
- Cluster Subdivision
- Conservation Easement
- Fluvial Hazard Zones
- Land Acquisition
- Overlay Zoning
- Stream Buffers and Setbacks
Improving Site Development Standards
- Stormwater Ordinance
- Site-specific Assessment
- Subdivision and Site Design Standards
- Use-specific Standards
Colorado communities are impacted by flooding on an annual basis, and nearly every community in the state is subject to special flood hazard areas as mapped by FEMA and as made available through the Colorado Water Conservation Board. In addition, there are approximately 677 state-regulated dams that, in the event of a failure, could cause loss of life and/or significant property damage in communities located within downstream flood hazard areas.
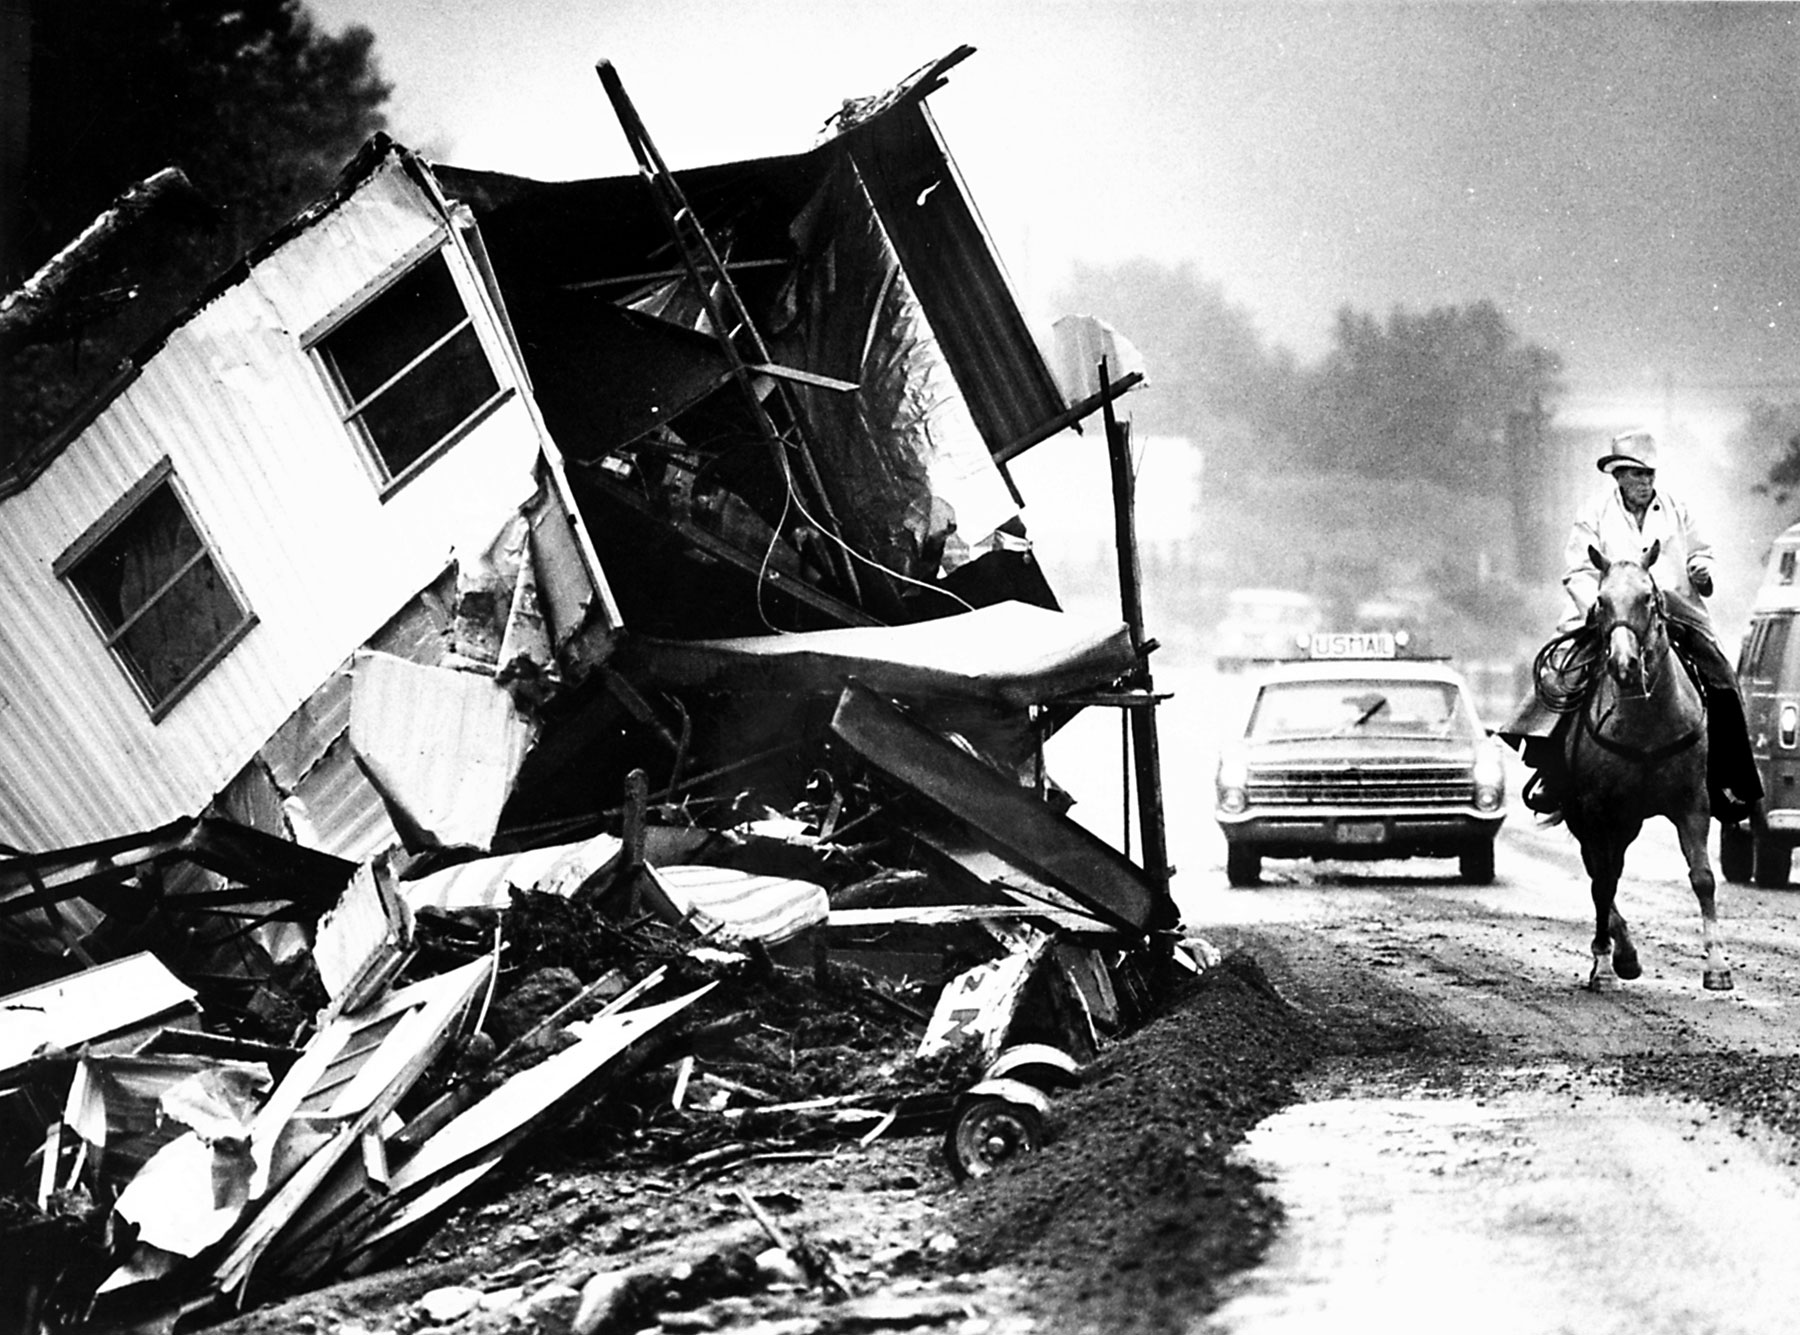
The most flash-flood prone regions of Colorado are found along the base of the lower foothills east of the mountains. Several extreme floods such as the infamous Big Thompson Canyon flood of July 31, 1976, have occurred in this vulnerable area. Flash floods occur on the Western Slope as well, but with typically lower frequency and intensity due to a reduced supply of moisture to fuel such storms (Colorado Climate Center).
Flood hazards pose major risks to property and human life and have caused some of the largest disasters in Colorado history in terms of financial costs and casualties. Between 20 to 30 large-magnitude floods occur somewhere in the state every year, and major flood disasters (warranting a federal disaster declaration) have occurred on average every five years since 1959. The South Platte River floods of 1965 and the 2013 floods in the Front Range and northeast counties caused multiple deaths and nearly $3 billion and $4 billion in total estimated damage in current terms, respectively. The Big Thompson River flood of 1976 caused 144 deaths. Floods can cause billions of dollars of property and infrastructure damage, resulting in significant economic impacts for directly affected communities and for the state as a whole (Colorado Resiliency Framework).
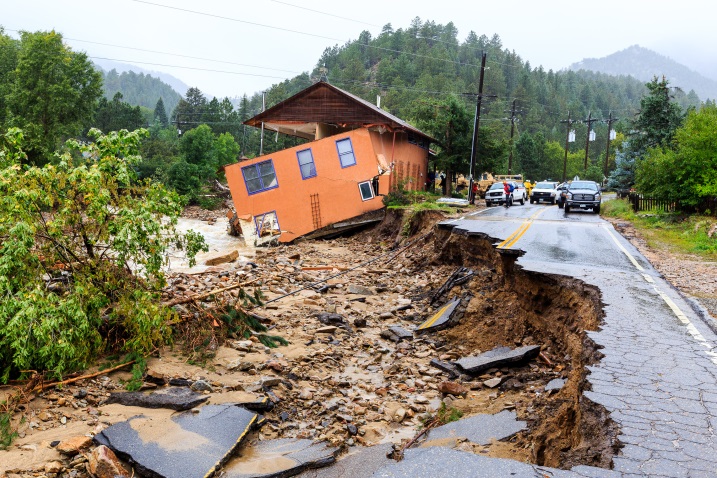
May 1, 2014. Photo by Steve Sumwalt.
The September 2013 flood disaster caused major damage to private property and public infrastructure across the Front Range of Colorado. Source - Federal Emergency Management Agency. Colorado Town Isolated. May 1, 2014. Photo by Steve Sumwalt.
While floods are most frequently caused by heavy precipitation associated with sustained wet weather and/or severe thunderstorms, they may also be caused or exacerbated by other hazards including ice jams or rapid melting and runoff following severe winter storms. In the 2013 Colorado floods, a major cause of flood damage was debris that clogged up bridges and culverts. Another major issue in 2013 was erosion and sedimentation related to natural river processes that are not always captured by floodplain maps. The State has developed a new program and mapping protocol related to identifying risks associated with channel migration, erosion, and deposition of sediment and debris associated as a result of fluvial processes. For more information see Fluvial Hazards.
Flooding is one of the three central components (along with drought and wildfire) of a complex system of interrelated natural hazards that are fundamentally tied to Colorado’s continental semi-arid climate. Drought conditions may lead to soil compaction, and wildfires may leave slopes denuded and hydrophobic (unable to absorb water). In these cases a single heavy rain event can lead to higher volumes of runoff and a correspondingly higher risk for flash flooding, erosion, and particularly mud/debris flows (described below in this guide).
In addition to the direct impacts a flood event hazard may cause, it can also trigger multiple cascading hazard events. Rising floodwaters may cause the failure of a dam, levee, or other impoundment structure resulting in the rapid inundation of locations outside of mapped special flood hazard areas. Major flood events may also increase the risks of geologic hazard events (landslide, mud/debris flow, and rockfall), soil hazards, and hazardous material releases.
Community planners should begin assessing flood risk by coordinating with their local floodplain administrator, along with the appropriate staff at the Colorado Water Conservation Board (CWCB), on the identification of the best currently available data and tools for assessing flood risk, as well as the status of any updates or possible enhancements to those resources.
Communities with GIS resources available to support their planning efforts will be able to conduct more rapid and robust risk assessments, including overlay analysis, to quantify the exposure of people, parcels, buildings, critical facilities, and other community assets that are within Special Flood Hazard Areas (SFHAs) and other community assets that are within Special Flood Hazard Areas (SFHAs) or Fluvial Hazard Zones (FHZ). They may also use FEMA’s Hazus software to help estimate monetary losses based on a variety of scenario flood hazard events (this capability exists even for communities without their own digital flood risk data). However, while Hazus is a helpful loss estimation tool, it is not predictive of future events. Communities that do not have GIS capabilities or resources should consult the range of digital online mapping viewers available, including the Colorado Flood Decision Support System (DSS) or the FEMA Flood Map Service Center. These mapping tools allow for some higher-level spatial analysis and the creation of customizable and printable flood maps (FIRMettes) that can be helpful in assessing flood risk for local planning and regulatory measures. In some cases, however, communities may have on-the-ground information that is better than modeling, such as, for example, public works records of roads and bridges that consistently have issues in flood events.
Most communities in Colorado rely on their effective floodplain maps (i.e., Flood Insurance Rate Maps issued by FEMA that become effective on a particular date) as the official source of flood risk information for local planning and regulatory measures, which at a minimum includes adopting and enforcing the State’s Model Floodplain Damage Prevention Ordinance (Colorado Department of Natural Resources). All communities in Colorado with mapped flood hazard areas have access to either hard copy/static Flood Insurance Rate Maps (FIRMs) or Digital Flood Insurance Rate Maps (DFIRMs), along with the associated Flood Insurance Study from the FEMA Flood Map Service Center. Communities with GIS capability but without DFIRM datasets may still have access to digital Q3 flood layers, which provide some limited spatial data for GIS analysis and mapping purposes. Many communities would be well-served to add Fluvial Hazard Maps to their toolbox as these maps combined with floodplain maps provide a more holistic picture of risk related to floods in a stream corridor.
The delineation and updating of floodplain maps is generally performed by private engineering firms under contract with FEMA, which administers the nation’s flood hazard mapping program in coordination with CWCB. Based on strict guidelines, floodplain maps are created through the use of statistical information such as data for river flows, rainfall and topographic surveys, and hydrologic and hydraulic (H&H) analyses. Hydrologic modeling calculates the peak discharges of water at key locations in a watershed, while hydraulic modeling computes surface water velocities and elevations along with flood profiles and flood boundaries using input from the hydrologic models. FEMA offers technical guidelines and standards for flood risk analysis and mapping.
Fluvial Hazard Maps are considered best practice and not regulated by the Federal or State government. The Colorado Water Conservation Board provides information on the technical aspects of fluvial hazard mapping.
The primary gaps or weaknesses with these tools may include outdated and/or inaccurate map data. Even new DFIRMs may not reflect all flood hazards (e.g., urban drainage/stormwater flooding, fluvial erosion, etc.) or future conditions (e.g., future floodplains and base flood elevations that take into account projected watershed development, hydrologic changes, etc.). Also, aside from a few new Risk MAP projects, most flood risk databases do not include the non-regulatory information that may be useful for enhanced planning purposes (e.g., flood depth/velocity grids, areas of mitigation interest, and other flood risk assessment data). Another challenge for many communities is the lack of GIS capabilities or resources to help facilitate the spatial analysis and mapping of flood risk to support the implementation of additional planning tools or strategies.
The 2013 floods highlighted the need for better mapping (including floodplains, erosion zones, and debris flows), and in response the Colorado legislature provided funding in early 2015 to update natural hazard maps statewide. This update process is currently underway.
Communities that are interested in adjusting or improving the quality of their floodplain maps, or expanding on the accessible flood risk products associated with development, should coordinate closely with the CWCB. While flood risk studies and hazard mapping are often prohibitively expensive, a range of techniques is available to communities through higher regulatory standards encouraged under the National Flood Insurance Program (NFIP) and Community Rating System (CRS) that should be considered.
Fluvial Hazard Maps, conversely, should be relatively affordable for communities to produce and provide a wide variety of options, both regulatory and non-regulatory, for use. For example, if a community is interested in regulating new development to flood elevations that are expected to increase due to future growth and development, it may consider the use of future-conditions hydrology in the creation of its own regulatory floodplain maps. Such maps can account for future floodplain conditions and may be adopted by communities to enact more stringent development standards, but would not be linked to insurance rates and purchase requirements under the NFIP. In the absence of pursuing the development of future floodplain conditions maps (which is not part of FEMA’s flood hazard mapping program and may be costly), communities may consider adopting the 500-year (or 0.2-percent-annual-chance) flood zone as their regulatory floodplain versus the 100-year (or 1-percent-annual-chance flood zone) as currently required under the NFIP.
Colorado Risk MAP
The purpose of the Colorado Risk MAP Program is to deliver quality data, technical assistance, and other non-regulatory tools that increase public awareness of flooding potential and lead to action that reduces risk to life and property.
Colorado Fluvial Hazard Mapping Program
The Colorado Water Conservation Board has developed methods for defining stream corridors, including lands adjacent to the stream channel that have been shaped by stream erosion and deposition under the prevailing flow and sediment regimes, as part of the Colorado Fluvial Hazard Zone Delineation Protocol. Fluvial Hazard Maps may be used to identify where the deposition and storage of water, sediment, and organic material is likely during a flood. The CWCB seeks to work with community organizations and planners to identify high priority areas for the development of Fluvial Hazard Maps.
Colorado Flood Decision Support System (DSS)
The Colorado Flood DSS is an online interactive mapping application that provides useful flood hazard information.
The application allows users to:
- Review effective floodplain boundaries
- See real-time weather and streamflow conditions
- Access local and county data related to flooding
- Access data related to historical floods, hazards, weather modification, watershed restoration, and FEMA’s National Flood Insurance Program
In addition, the DSS provides links to a wide range of additional resources for flood-related information.
FEMA Flood Map Service Center
The Flood Map Service Center is the official public source for flood hazard information produced in support of the National Flood Insurance Program. From this site, users can obtain official flood maps, access a range of other flood hazard products including Flood Insurance Studies (FIS), and take advantage of tools to better understand flood risk.
Colorado Hazus Flood Risk Data
The 2023-2028 Colorado Enhanced State Hazard Mitigation Plan includes planning-level flood loss estimates for every county in Colorado, as generated by Hazus, FEMA’s loss estimation software. This includes a summary of vulnerability and potential losses by county, as determined though modeling the one percent annual chance (100-year) floodplain and performing associated building and population risk assessments across the state.
Colorado National Flood Insurance Program (NFIP) information
State NFIP, repetitive loss, and Risk MAP data is available through the Colorado Water Conservation Board or the Division of Homeland Security and Emergency Management.
NFIP Policy and Claim Statistics by Jurisdiction
These policy and claim statistics provide routinely updated data on the number of policies in-force, amount of coverage, and premiums paid for each participating NFIP community, along with data on the number of insured losses and total payments of past claims.
Colorado Dam Safety Information
Upon request, the Colorado Division of Water Resources (DWR) can provide helpful data and information to local officials on existing dam structures, such as hazard classifications, emergency action plans, and dam failure inundation maps. Access to all such information is subject to DWR’s Public Access to Dam Files and Records policy.